
Neural Networks Observability and Monitoring
What we can observe about an Artificial Intelligence application

Happy New Year!!!! During the break I spent some time trying to understand the concept of Observability in LLM and ass software engineers and architects of large systems and software, this is an important feature that we have to consider all the time and ability to monitor how the system behave at different point in time and under different set of circumstances. The reason why we do that is to be able to understand if the system that we built is meeting the expectation using
Real-time monitoring of system health
Debugging of the system behaviour
Performance optimization
Anomaly detection
Capacity planning
Now the question is, what capabilities we have to monitor AI Model and in specific Neural Network? What are the differences between observe and monitor a deterministic system in comparison to monitor a non-deterministic one? Here we go let me try to provide you my current understanding of the state of the art.
As architects, we're familiar with the three pillars of observability

Metrics
Quantitative measurements of system behaviour
Key focus: Performance indicators like latency, throughput, resource usage
Logs
Time stamped records of discrete events and state changes
Key focus: Debugging, audit trails, compliance
Traces
End-to-end request flow through system components
Key focus: Performance bottlenecks, error propagation
Let's see how these concepts map to neural network observability and what new considerations emerge.
System Architecture Parallel
Imagine you're designing a microservices’ architecture. You have:

You monitor this using:
1. Metrics (throughput, latency)
2. Logs (error messages, state changes)
3. Traces (request flow through services)
Now, consider a neural network architecture:
To understand how and what we can monitor let’s use a very common user journey where a person is chatting with an AI Model, we can split this journey in different stage for clarity
Stage 1: Prompt Input Processing
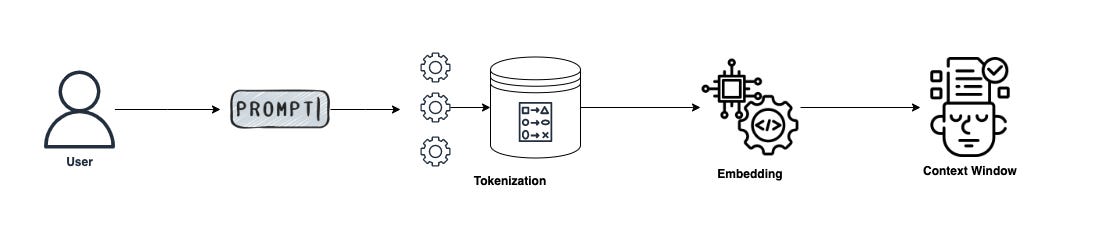

Stage 2: Model Processing
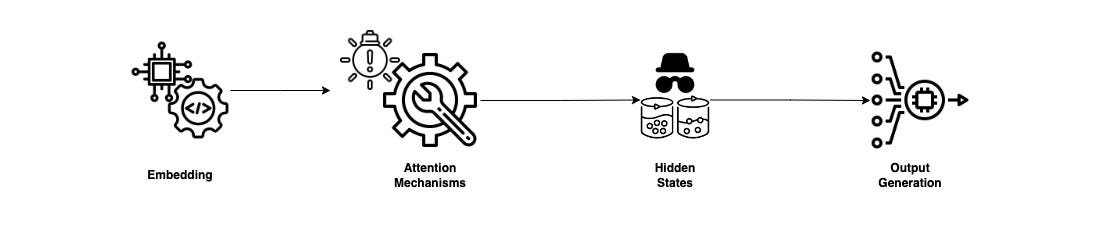

Stage 3: Output Generation


The "Black Box" Nature of Neural Networks
Neural networks fundamentally operate as complex distributed systems where "intelligence" emerges from the collective interaction of millions of interconnected nodes, rather than from explicit, programmed logic. Unlike traditional software systems where we can trace decision trees or follow logical pathways, a neural network's "thinking" is spread across its entire architecture, with no single neuron or layer containing complete concepts or decision points. This distributed nature means that when a network processes information – whether recognizing a face, interpreting text, or making predictions – it does so through countless parallel computations that occur simultaneously across its entire structure. The decision-making process cannot be traced because it doesn't follow sequential steps; instead, decisions emerge from the interaction of all components, similar to how human intuition works. We can observe the input (like an image) and the output (like "this is a cat"), but the actual process of reaching that conclusion exists as patterns of activation across the network's distributed architecture. This creates a fundamental challenge for system architects and developers: while we can monitor performance metrics, resource usage, and input-output relationships, we cannot inspect the actual reasoning process or understand why specific decisions were made. This limitation isn't a flaw in our monitoring capabilities, but rather a fundamental characteristic of how neural networks operate. Just as we cannot isolate the exact neurons in a human brain that contribute to recognizing a friend's face or understanding a complex concept, we cannot trace the specific pathways in a neural network that lead to its conclusions. This understanding is crucial for architects, as it influences how we approach system design, monitoring, validation, and risk management – forcing us to focus on observable behaviours and outcomes rather than internal logic, and to implement robust testing frameworks and validation strategies that don't rely on understanding the internal decision-making process.
From an engineering point of view, it’s important to understand how to “wrap” the different AI Model with software application and how to monitor it
Deep Dive into Observability for Generative AI Applications
As artificial intelligence continues to evolve, we find ourselves working with an entirely new class of software systems - Generative AI applications. Unlike traditional software that follows predetermined paths, these applications can generate novel content, engage in natural conversations, and even write code. This fundamental shift in how software operates requires us to rethink our approach to observability.
Generative AI applications represent a significant departure from traditional software systems. Think of them as creative collaborators rather than just tools that follow instructions. When you interact with a GenAI application, you're engaging with a system that can generate new and unique outputs each time, much like having a conversation with a knowledgeable colleague. This generative nature introduces unique challenges for monitoring and understanding system behavior.
Core Monitoring Dimensions: A Practical Guide
Let's break down the essential aspects of GenAI observability into understandable components that anyone building or managing these systems can grasp and implement.
Prompt Engineering Metrics: Understanding Your AI Conversations
Think of prompt engineering metrics as a quality control system for conversations with your AI. Just as we might analyse customer service interactions to improve service quality, we need to understand which ways of communicating with AI systems produce the best results.
In practical terms, we monitor:
Prompt length and complexity (Is shorter or longer better?)
Question structure (Do examples help? Should we break questions into parts?)
Pattern effectiveness (Which approaches consistently get better responses?)
Measure how well the prompt worked
Think of prompt engineering metrics as a quality control system for conversations with your AI. Just as we might analyse customer service interactions to improve service quality, we need to understand which ways of communicating with AI systems produce the best results.
In practical terms, we monitor:
Prompt length and complexity (Is shorter or longer better?)
Question structure (Do examples help? Should we break questions into parts?)
Pattern effectiveness (Which approaches consistently get better responses?)
Here's how we implement this monitoring:
Token Usage and Economics: Managing Your AI Budget
Just as you would monitor your phone bill or cloud computing costs, token usage monitoring helps you understand and control the costs of your AI interactions. Each word or piece of a word processed by the AI counts as a token, and these add up quickly in production systems.
This monitoring helps you:
Track costs per conversation
Identify expensive interaction patterns
Optimize prompts for efficiency without sacrificing quality
Response Quality Assessment: Ensuring Reliable AI Outputs
Just as traditional software needs quality assurance, GenAI applications need systematic ways to evaluate their outputs. This is particularly important because AI responses can vary significantly and might sometimes include incorrect or inappropriate content.
Our quality monitoring system checks for:
- Response coherence (Does it make logical sense?)
- Answer relevance (Does it address the actual question?)
- Factual accuracy (Is it making up information?)
- Content safety (Is it appropriate and aligned with policies?)
Model Performance Correlation and System Integration
Just as a car's performance depends on multiple factors like road conditions, fuel quality, and driver behavior, AI model performance is influenced by various interrelated factors. Model Performance Correlation helps us understand these relationships in practical terms.
Think of it as having a sophisticated diagnostic system that helps you understand:
How different types of inputs affect your AI's response quality
How busy periods impact response times
Whether users are actually getting value from the AI's outputs
Multi-layered Data Collection
Imagine your GenAI application as a multi-story building - you need to monitor conditions on each floor while also understanding how they affect the building as a whole. This is why we need a multi-layered approach to data collection.
At the ground level (Application Layer), we track:
Basic health metrics (response times, error rates)
System resource usage
API call patterns
At the upper levels (Model Layer), we monitor:
Model inference times
Token consumption patterns
Quality metrics for model outputs
Putting It All Together
These monitoring systems work together to give you a complete picture of your GenAI application's health and performance. By implementing all three aspects, you create a comprehensive observability solution that helps you:
Optimize your AI interactions
Control costs while maintaining quality
Ensure reliable and safe AI responses
I hope this post gives you a clearer understanding of what we can and can’t observe about AI. Here are some resources that can help you dive deeper into related topics.
Instana AI Observability by my colleague Guangya Liu
What is LLM Observability and LLM Monitoring? By Langfuse
Physics-Informed Deep Neural Network Method for Limited Observability State Estimation By Jonatan Ostrometzky, Konstantin Berestizshevsk, Andrey Bernstein , Gil Zussman
See you next month!!
The article is very interesting but the audio is unbearable. If the audio is not AI generated then please next time try to stop talking over each other and repeating each other’s sentences word for word. If the audio is AI generated please find another vendor.
very informative content. @marco thanks for sharing.